
| 일 | 월 | 화 | 수 | 목 | 금 | 토 |
|---|---|---|---|---|---|---|
| 1 | 2 | 3 | 4 | |||
| 5 | 6 | 7 | 8 | 9 | 10 | 11 |
| 12 | 13 | 14 | 15 | 16 | 17 | 18 |
| 19 | 20 | 21 | 22 | 23 | 24 | 25 |
| 26 | 27 | 28 | 29 | 30 | 31 |
Tags
- Python
- analyzer test
- Elasticsearch
- zip 파일 암호화
- API
- Mac
- matplotlib
- aggregation
- 파이썬
- License
- springboot
- sort
- 900gle
- flask
- Kafka
- TensorFlow
- Java
- 차트
- plugin
- license delete
- MySQL
- ELASTIC
- high level client
- aggs
- licence delete curl
- docker
- token filter test
- query
- Test
- zip 암호화
Archives
- Today
- Total
개발잡부
[matplotlib] 기본그래프 본문
반응형
코드 1
import matplotlib.pyplot as plt

plt.plot([1, 2, 3, 4])
plt.show()
결과
#실행
python src/Chart.py
기본 그래프
음..
음..
스타일지정
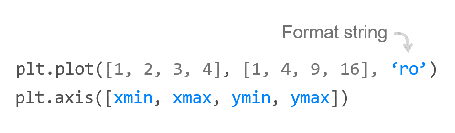
코드 2
import matplotlib.pyplot as plt

#그리고
plt.plot([1, 2, 3, 4], [1, 4, 9, 16], 'ro')
plt.axis([0, 6, 0, 20])

#보여준다
plt.show()
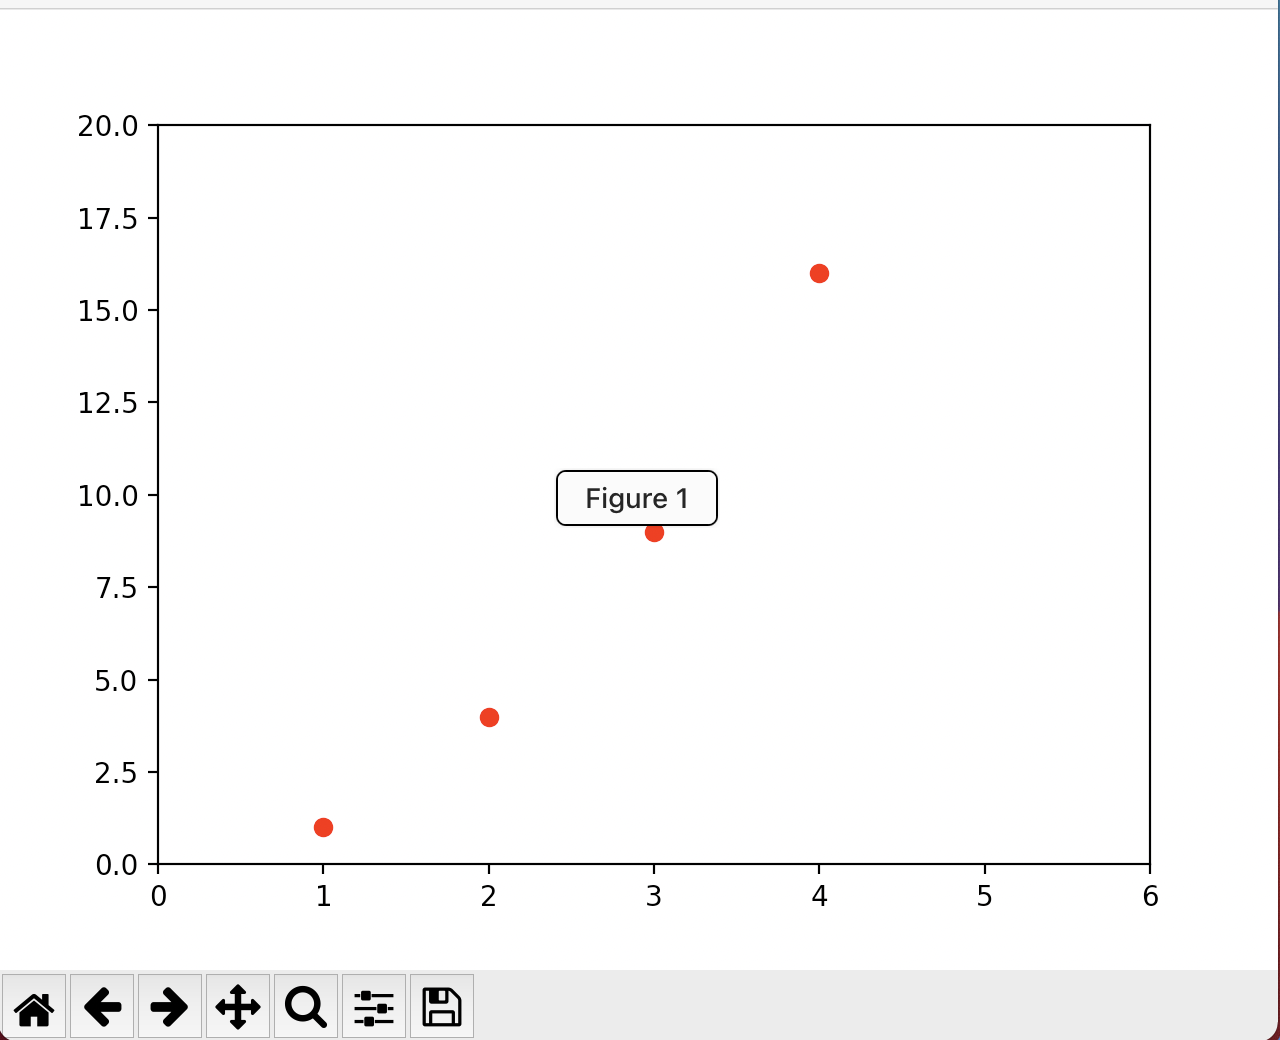
포맷 문자열 ‘ro’는 빨간색 (‘red’)의 원형 (‘o’)
‘b-‘는 파란색 (‘blue’)의 실선 (‘-‘)
정리가 필요하군..
matplotlib.pyplot 모듈의 axis() 함수를 이용해서 축의 범위 [xmin, xmax, ymin, ymax]를 지정
여러 개의 그래프 그리기
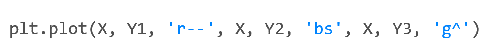
코드 3
import matplotlib.pyplot as plt
import numpy as np

# 200ms 간격으로 균일하게 샘플된 시간
t = np.arange(0., 5., 0.2)

# 빨간 대쉬, 파란 사각형, 녹색 삼각형
plt.plot(t, t, 'r--', t, t**2, 'bs', t, t**3, 'g^')
plt.show()

numpy Array 에 대해서 공부좀 해야겠다
코드 4
레이블이 있는 데이터
import matplotlib.pyplot as plt

data_dict = {'data_x': [1, 2, 3, 4, 5], 'data_y': [2, 3, 5, 10, 8]}

plt.plot('data_x', 'data_y', data=data_dict)
plt.xlabel('X-Axis', labelpad=15)
plt.ylabel('Y-Axis', labelpad=20)
plt.show()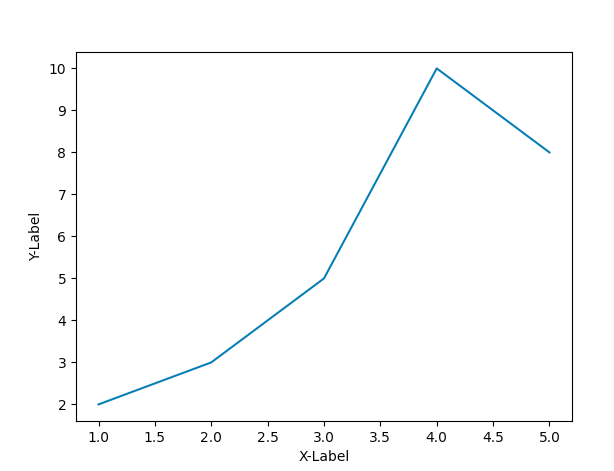
레이블 추가
labelpad : 여백 (padding)
위치지정하기
코드 5
import matplotlib.pyplot as plt

font1 = {'family': 'serif',
         'color': 'b',
         'weight': 'bold',
         'size': 14
         }

font2 = {'family': 'fantasy',
         'color': 'deeppink',
         'weight': 'normal',
         'size': 'xx-large'
         }

plt.plot([1, 2, 3, 4], [2, 3, 5, 10])
plt.xlabel('X-Axis', labelpad=10, fontdict=font1, loc='right')
plt.ylabel('Y-Axis', labelpad=20, fontdict=font2, loc='top')
plt.show()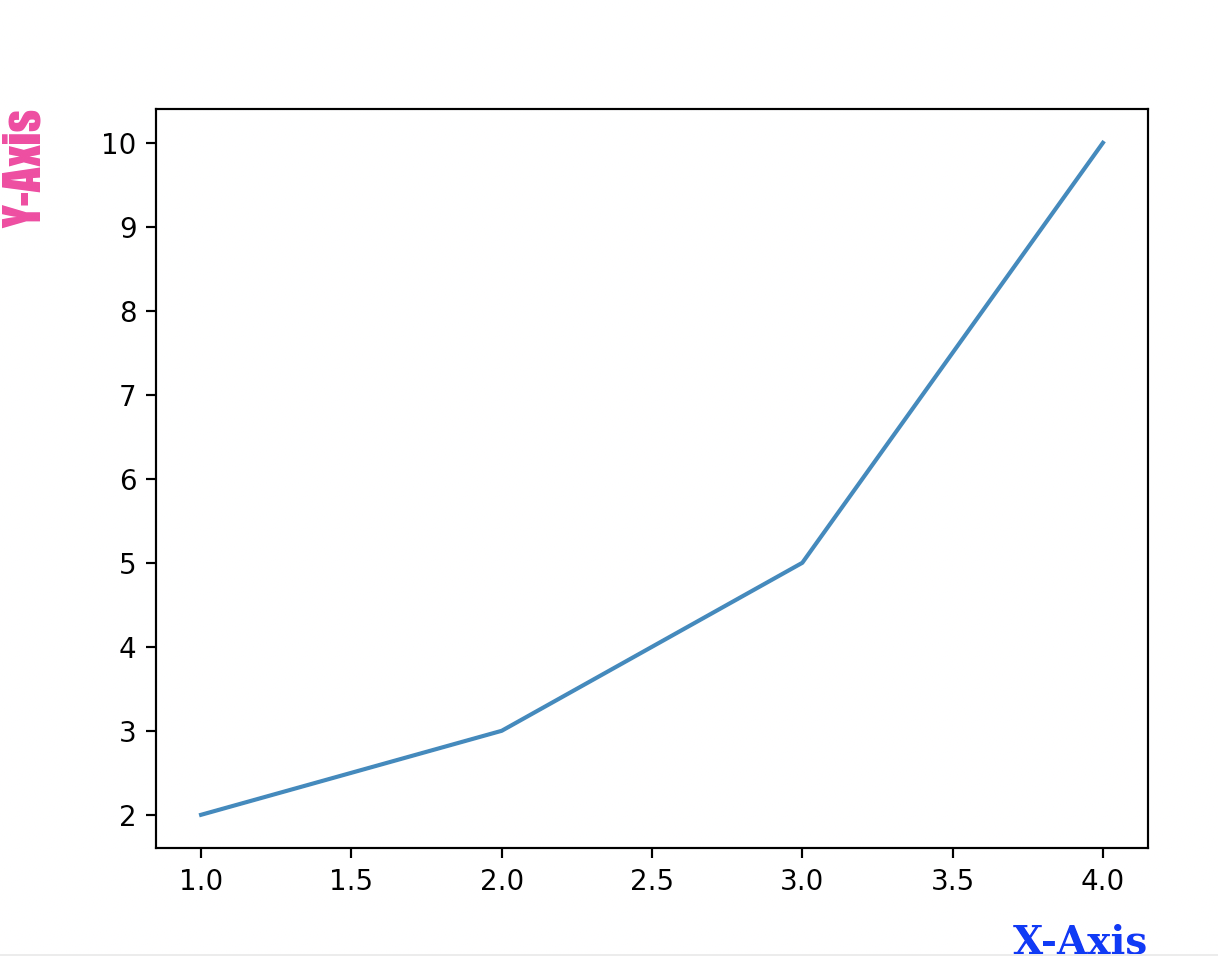
labelpad : 여백
fontdict : 폰트
loc : 위치 - 파라미터는 Matplotlib 3.3 이후 버전부터
범례지정과 위치 지정하기
코드 6
import matplotlib.pyplot as plt

font1 = {'family': 'serif',
         'color': 'b',
         'weight': 'bold',
         'size': 14
         }

font2 = {'family': 'fantasy',
         'color': 'deeppink',
         'weight': 'normal',
         'size': 'xx-large'
         }

plt.plot([1, 2, 3, 4], [2, 3, 5, 10], label='price ($)')
plt.xlabel('X-Axis', labelpad=10, fontdict=font1, loc='right')
plt.ylabel('Y-Axis', labelpad=20, fontdict=font2, loc='top')
plt.legend(loc=(0.05, 0.9))
plt.show()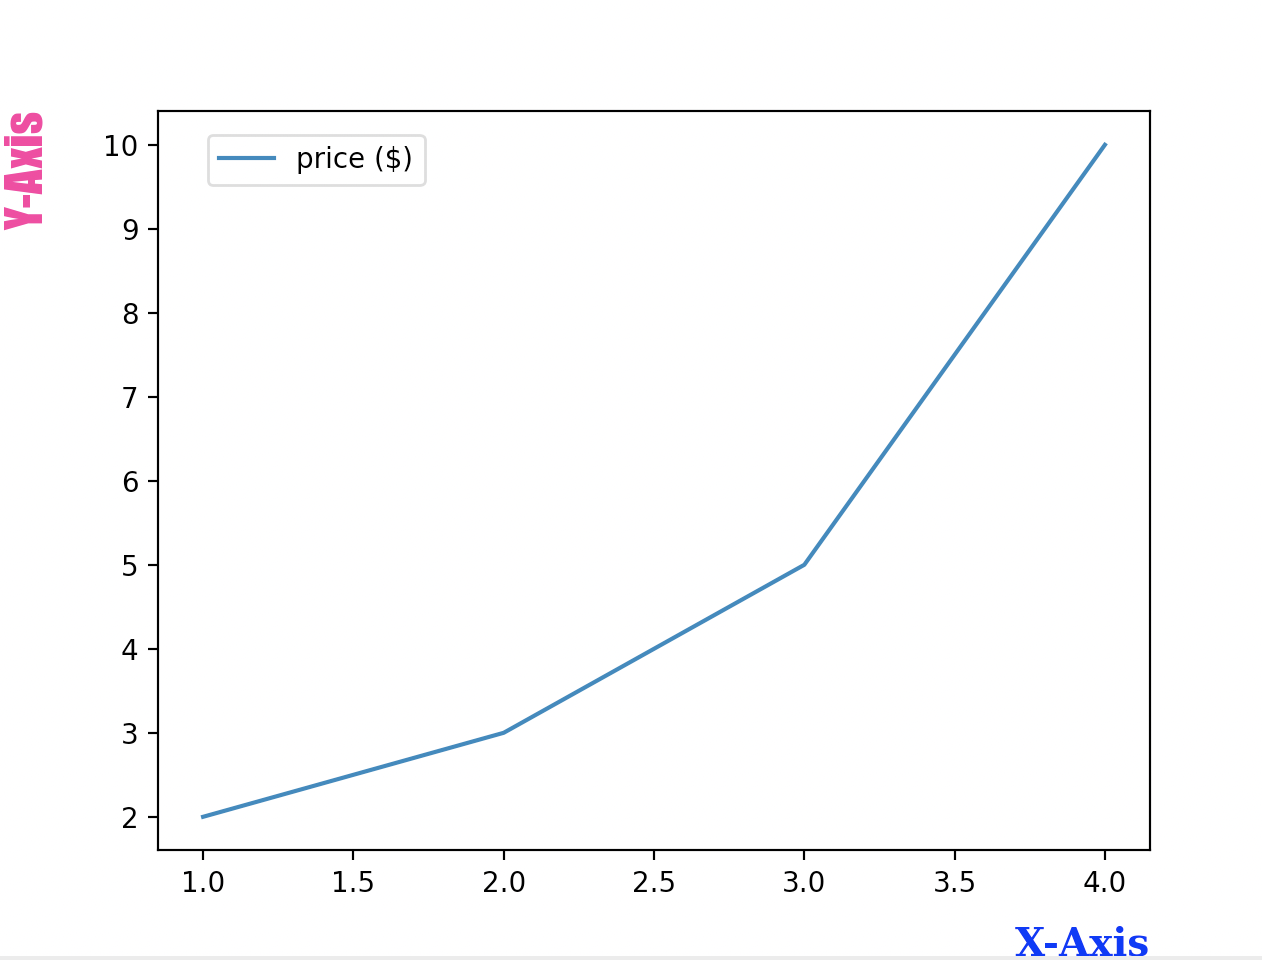
범례 :
label='price ($)'
범례 지정 후 legend() 함수 호출
범례의 위치 지정 : loc
plt.legend(loc=(0.05, 0.9))
열 지정
코드 7
import matplotlib.pyplot as plt
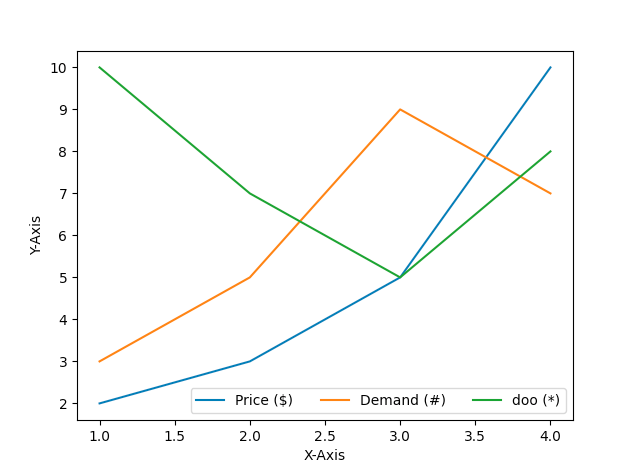
plt.plot([1, 2, 3, 4], [2, 3, 5, 10], label='Price ($)')
plt.plot([1, 2, 3, 4], [3, 5, 9, 7], label='Demand (#)')
plt.plot([1, 2, 3, 4], [10, 7, 5, 8], label='doo (*)')
plt.xlabel('X-Axis')
plt.ylabel('Y-Axis')
# plt.legend(loc='best') # ncol = 1
plt.legend(loc='best', ncol=3) # ncol = 2
plt.show()3열과 1열
폰크 크기와 테두리 꾸미기
코드 8
import matplotlib.pyplot as plt
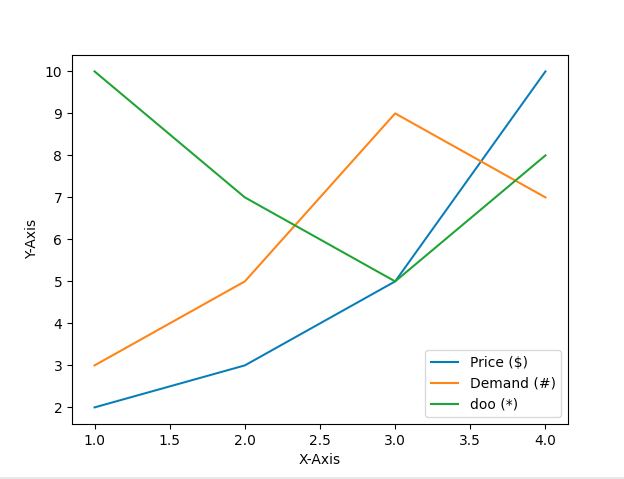
plt.plot([1, 2, 3, 4], [2, 3, 5, 10], label='Price ($)')
plt.plot([1, 2, 3, 4], [3, 5, 9, 7], label='Demand (#)')
plt.plot([1, 2, 3, 4], [10, 7, 5, 8], label='doo (*)')
plt.xlabel('X-Axis')
plt.ylabel('Y-Axis')
plt.legend(loc='best', ncol=2, fontsize=14, frameon=True, shadow=True)
plt.show()

frameon : 테두리를 표시할지 여부를 지정
shadow : 그림자 표시 여부 지정
facecolor :
edgecolor :
borderpad :
labelspacing :
https://matplotlib.org/stable/api/_as_gen/matplotlib.pyplot.legend.html
반응형
'Python > matplotlib' 카테고리의 다른 글
| [matplotlib] line chart sample 1 (0) | 2022.08.19 |
|---|---|
| [matplotlib] 한글깨짐 (0) | 2022.01.18 |
| [matplotlib] 선그래프 응용 (0) | 2021.12.30 |
| [matplotlib] 기본그래프2 (0) | 2021.12.30 |
| [matplotlib] Matplotlib 설치하기 (0) | 2021.12.30 |
'Python/matplotlib' Related Articles
more


