
| 일 | 월 | 화 | 수 | 목 | 금 | 토 |
|---|---|---|---|---|---|---|
| 1 | 2 | 3 | ||||
| 4 | 5 | 6 | 7 | 8 | 9 | 10 |
| 11 | 12 | 13 | 14 | 15 | 16 | 17 |
| 18 | 19 | 20 | 21 | 22 | 23 | 24 |
| 25 | 26 | 27 | 28 | 29 | 30 | 31 |
Tags
- Kafka
- License
- zip 암호화
- Test
- springboot
- Elasticsearch
- aggregation
- zip 파일 암호화
- sort
- 900gle
- Java
- API
- matplotlib
- ELASTIC
- docker
- 파이썬
- analyzer test
- Python
- plugin
- licence delete curl
- TensorFlow
- license delete
- aggs
- MySQL
- 차트
- query
- high level client
- Mac
- token filter test
- flask
Archives
- Today
- Total
개발잡부
[matplotlib] 기본그래프2 본문
반응형
축범위 지정하기
코드 1
import matplotlib.pyplot as plt

plt.plot([1, 2, 3, 4], [2, 3, 5, 10])
plt.xlabel('X-Axis')
plt.ylabel('Y-Axis')
plt.xlim([0, 5])      # X축의 범위: [xmin, xmax]
plt.ylim([0, 20])     # Y축의 범위: [ymin, ymax]

plt.show()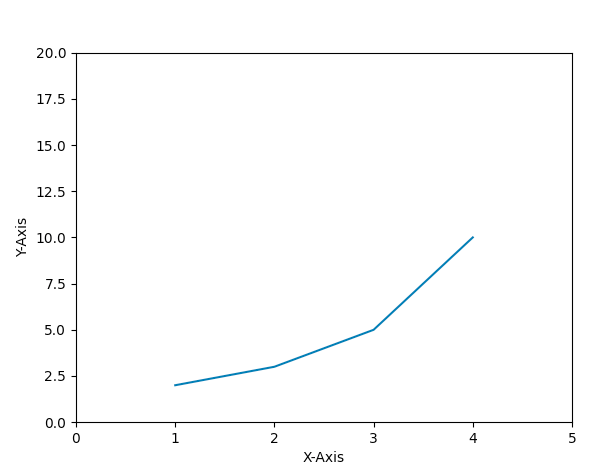
# X축의 범위: [xmin, xmax]
# Y축의 범위: [ymin, ymax]
plt.xlim([0, 5])
plt.ylim([0, 15])
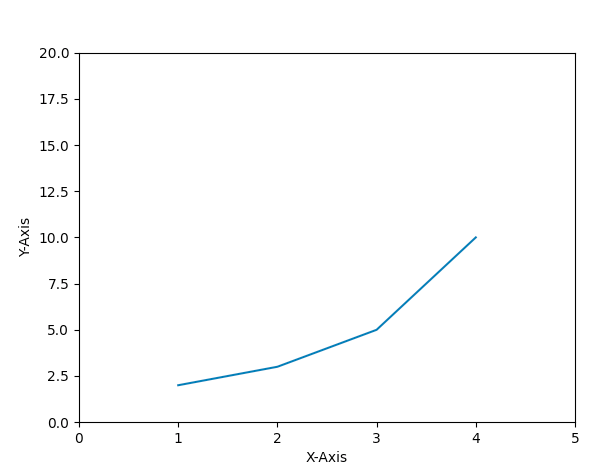
# X, Y축의 범위: [xmin, xmax, ymin, ymax]
plt.axis([0, 5, 0, 20])
반응형
'Python > matplotlib' 카테고리의 다른 글
| [matplotlib] line chart sample 1 (0) | 2022.08.19 |
|---|---|
| [matplotlib] 한글깨짐 (0) | 2022.01.18 |
| [matplotlib] 선그래프 응용 (0) | 2021.12.30 |
| [matplotlib] 기본그래프 (0) | 2021.12.30 |
| [matplotlib] Matplotlib 설치하기 (0) | 2021.12.30 |
'Python/matplotlib' Related Articles
more


Comments