
| 일 | 월 | 화 | 수 | 목 | 금 | 토 |
|---|---|---|---|---|---|---|
| 1 | 2 | 3 | 4 | 5 | 6 | 7 |
| 8 | 9 | 10 | 11 | 12 | 13 | 14 |
| 15 | 16 | 17 | 18 | 19 | 20 | 21 |
| 22 | 23 | 24 | 25 | 26 | 27 | 28 |
| 29 | 30 |
Tags
- matplotlib
- Mac
- aggs
- zip 암호화
- zip 파일 암호화
- token filter test
- 파이썬
- 차트
- Kafka
- aggregation
- Elasticsearch
- License
- flask
- docker
- springboot
- high level client
- plugin
- sort
- analyzer test
- 900gle
- ELASTIC
- MySQL
- TensorFlow
- API
- licence delete curl
- Java
- Python
- license delete
- Test
- query
Archives
- Today
- Total
개발잡부
[matplotlib] line chart sample 2 본문
반응형
import numpy as np
import matplotlib.pyplot as plt

x = np.arange(14)
y = np.sin(x / 2)

plt.step(x, y + 2, label='pre (default)')
plt.plot(x, y + 2, 'o--', color='grey', alpha=0.3)

plt.step(x, y + 1, where='mid', label='mid')
plt.plot(x, y + 1, 'o--', color='grey', alpha=0.3)

plt.step(x, y, where='post', label='post')
plt.plot(x, y, 'o--', color='grey', alpha=0.3)

plt.grid(axis='x', color='0.95')
plt.legend(title='Parameter where:')
plt.title('plt.step(where=...)')
plt.show()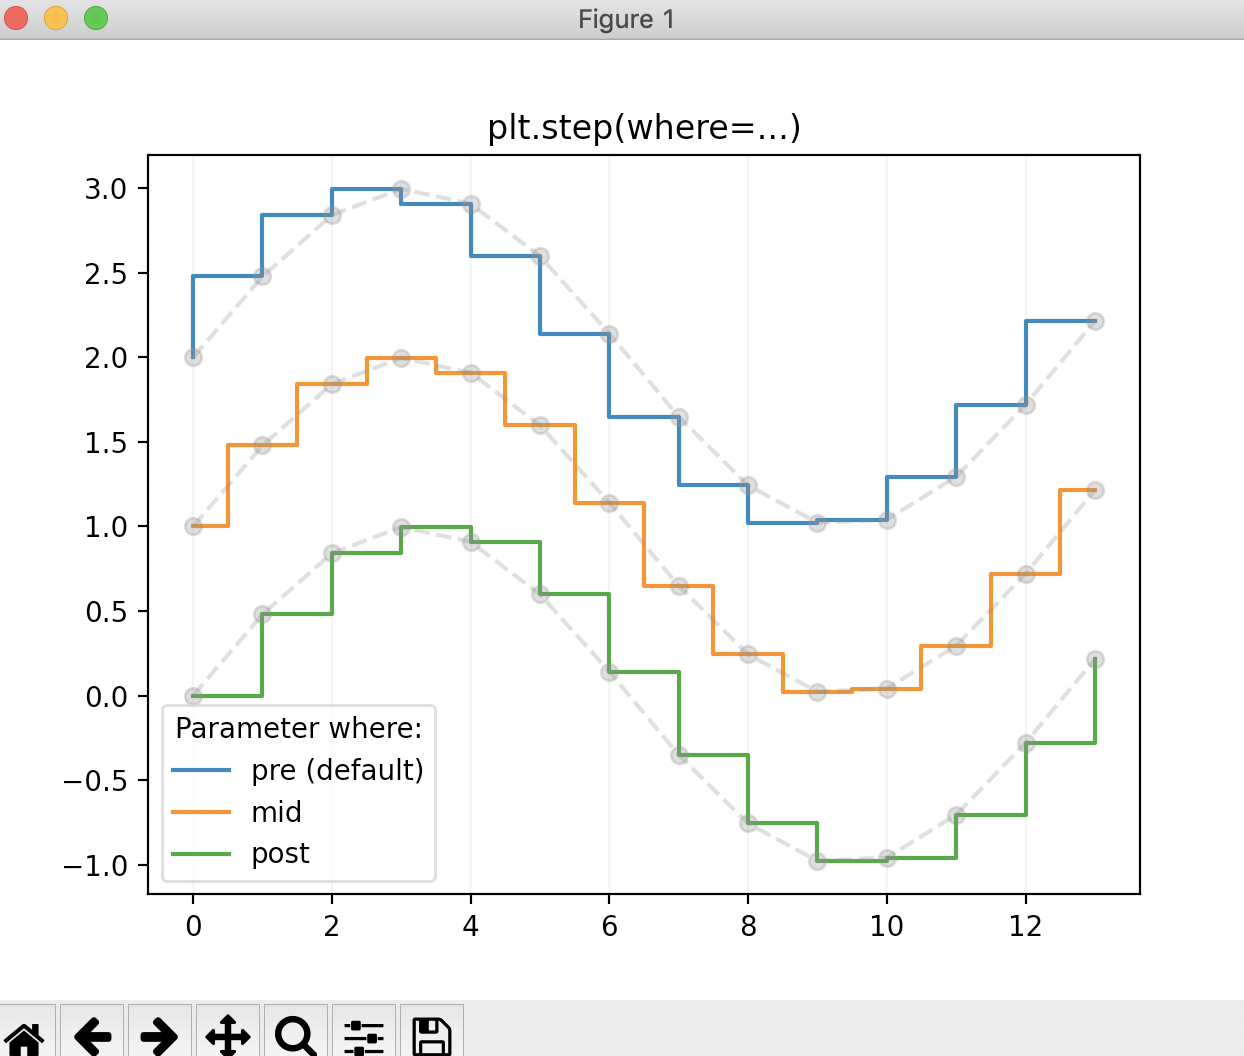
반응형
'Python > matplotlib' 카테고리의 다른 글
| [matplotlib] two subplot chart sample 1 (0) | 2022.08.19 |
|---|---|
| [matplotlib] pie chart sample 1 (0) | 2022.08.19 |
| [matplotlib] line chart sample 1 (0) | 2022.08.19 |
| [matplotlib] 한글깨짐 (0) | 2022.01.18 |
| [matplotlib] 선그래프 응용 (0) | 2021.12.30 |
'Python/matplotlib' Related Articles
more


Comments