
| 일 | 월 | 화 | 수 | 목 | 금 | 토 |
|---|---|---|---|---|---|---|
| 1 | 2 | 3 | 4 | 5 | ||
| 6 | 7 | 8 | 9 | 10 | 11 | 12 |
| 13 | 14 | 15 | 16 | 17 | 18 | 19 |
| 20 | 21 | 22 | 23 | 24 | 25 | 26 |
| 27 | 28 | 29 | 30 |
Tags
- springboot
- license delete
- token filter test
- 파이썬
- plugin
- MySQL
- licence delete curl
- query
- ELASTIC
- aggs
- API
- License
- sort
- Kafka
- zip 암호화
- 차트
- Java
- Test
- TensorFlow
- Elasticsearch
- analyzer test
- 900gle
- Mac
- Python
- docker
- matplotlib
- aggregation
- high level client
- flask
- zip 파일 암호화
Archives
- Today
- Total
개발잡부
[matplotlib] pie chart sample 1 본문
반응형
import matplotlib.pyplot as plt
import numpy as np

plt.style.use('_mpl-gallery-nogrid')


# make data
x = [1, 2, 3, 4]
colors = plt.get_cmap('Blues')(np.linspace(0.2, 0.7, len(x)))

# plot
fig, ax = plt.subplots()
ax.pie(x, colors=colors, radius=3, center=(4, 4),
       wedgeprops={"linewidth": 1, "edgecolor": "white"}, frame=True)

ax.set(xlim=(0, 8), xticks=np.arange(1, 8),
       ylim=(0, 8), yticks=np.arange(1, 8))

plt.show()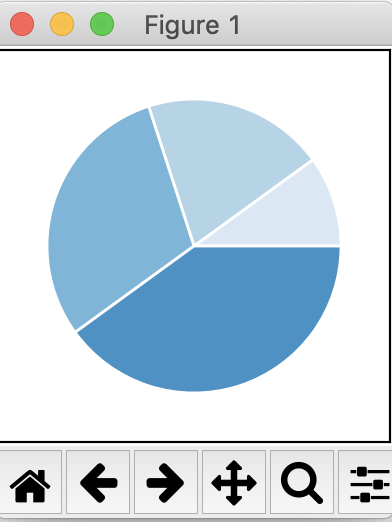
반응형
'Python > matplotlib' 카테고리의 다른 글
| [matplotlib] legend picking chart sample (0) | 2022.08.19 |
|---|---|
| [matplotlib] two subplot chart sample 1 (0) | 2022.08.19 |
| [matplotlib] line chart sample 2 (0) | 2022.08.19 |
| [matplotlib] line chart sample 1 (0) | 2022.08.19 |
| [matplotlib] 한글깨짐 (0) | 2022.01.18 |
'Python/matplotlib' Related Articles
more


Comments