
| 일 | 월 | 화 | 수 | 목 | 금 | 토 |
|---|---|---|---|---|---|---|
| 1 | 2 | 3 | 4 | 5 | 6 | 7 |
| 8 | 9 | 10 | 11 | 12 | 13 | 14 |
| 15 | 16 | 17 | 18 | 19 | 20 | 21 |
| 22 | 23 | 24 | 25 | 26 | 27 | 28 |
| 29 | 30 |
Tags
- API
- 차트
- matplotlib
- MySQL
- Elasticsearch
- flask
- token filter test
- plugin
- 파이썬
- TensorFlow
- Kafka
- 900gle
- aggs
- zip 파일 암호화
- sort
- Java
- License
- licence delete curl
- analyzer test
- ELASTIC
- license delete
- high level client
- Mac
- Python
- aggregation
- query
- docker
- Test
- springboot
- zip 암호화
Archives
- Today
- Total
개발잡부
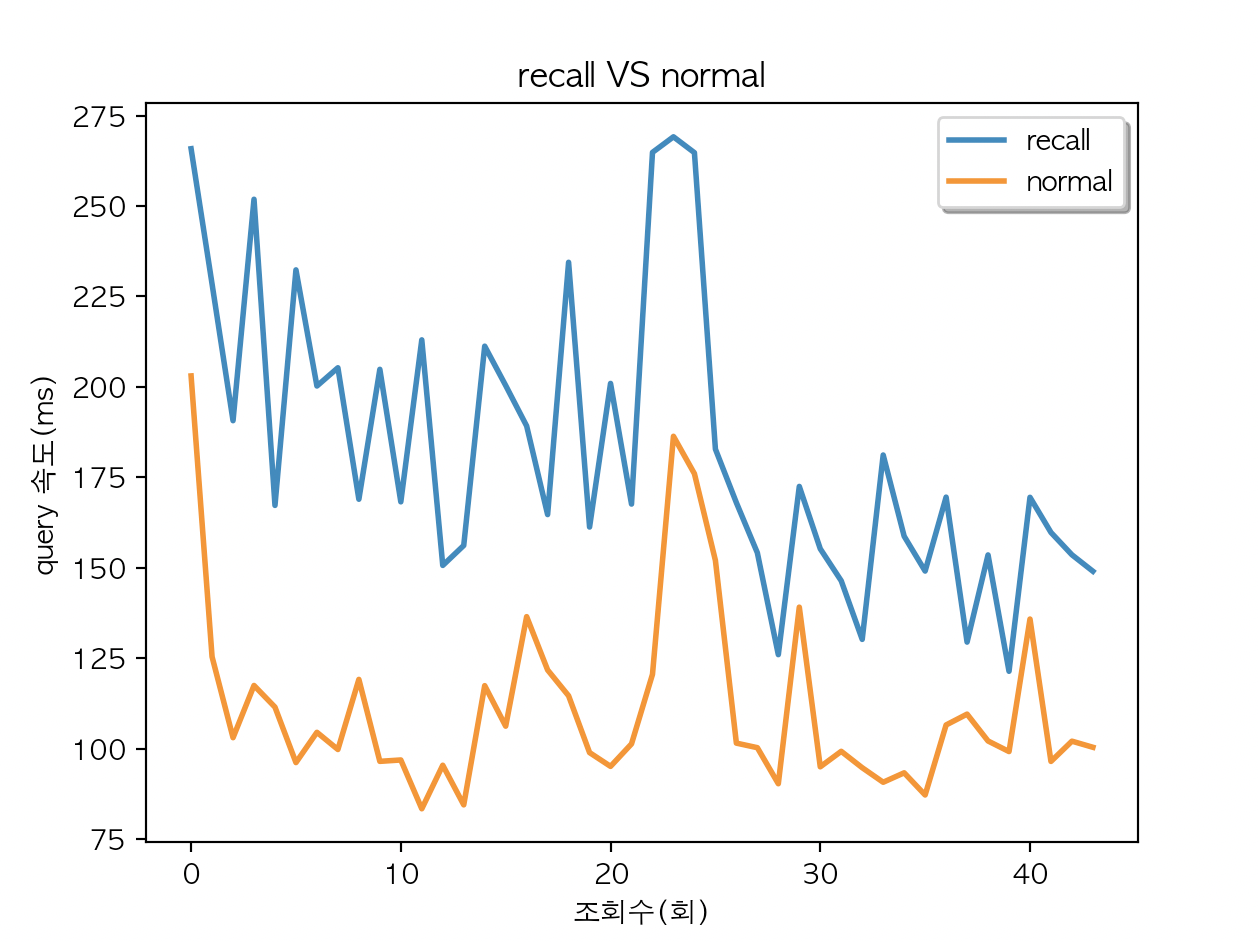
[matplotlib] 재현율 개선 쿼리와 일반쿼리 응답시간 비교 본문
반응형
# -*- coding: utf-8 -*-
import time
import json
import requests
import ssl
import urllib3
from ssl import create_default_context
import matplotlib.pyplot as plt
from matplotlib.collections import EventCollection
import numpy as np
from time import sleep
plt.rcParams['font.family'] = 'AppleGothic'
print(ssl.OPENSSL_VERSION)
urllib3.disable_warnings(urllib3.exceptions.InsecureRequestWarning)
def csv_data():
count = 1;
progress = 0;
api_data = []
jg_data = []
print("Start.")
with open(CSV_FILE) as data_file:
for line in data_file:
line = line.strip()
time.sleep(0.5)
url_jg = "https://totalsearch.kr/search?sort=RANK&inputKeyword=" + line + "&searchKeyword=" + line + "&page=1&perPage=20"
search_start = time.time()
response_jg = requests.get(url_jg, verify=False)
search_time = time.time() - search_start
jg_data.append(round(search_time * 1000, 2))
url_api = "https://totalsearch.kr/search?sort=RANK&inputKeyword=" + line + "&searchKeyword=" + line + "&page=1&perPage=20&recall=Y"
api_start = time.time()
response_api = requests.get(url_api, verify=False)
api_time = time.time() - api_start
api_data.append(round(api_time * 1000, 2))
print(line)
print("== Recall api 실행시간 ==")
for atimes in api_data:
print(str(atimes) + " ms.")
print("== Normal api 실행시간 ==")
for jtimes in jg_data:
print(str(jtimes) + " ms.")
# 평균 구하기
average_api = np.mean(api_data)
average_jg = np.mean(jg_data)
# print("전체쿼리 횟수: {} 회".format(len(keywords)))
print("Recall api 평균응답시간: {} ms.".format(round(average_api, 2)))
print("Normal 평균응답시간: {} ms.".format(round(average_jg, 2)))
apix = range(len(api_data))
jgx = range(len(jg_data))
# as-is, to-be 성능차이 계산
print("응답시간 증가 : {}%.".format(round(((average_api / average_jg) - 1) * 100, 2)))
# plot the data
fig = plt.figure()
ax = fig.add_subplot(1, 1, 1)
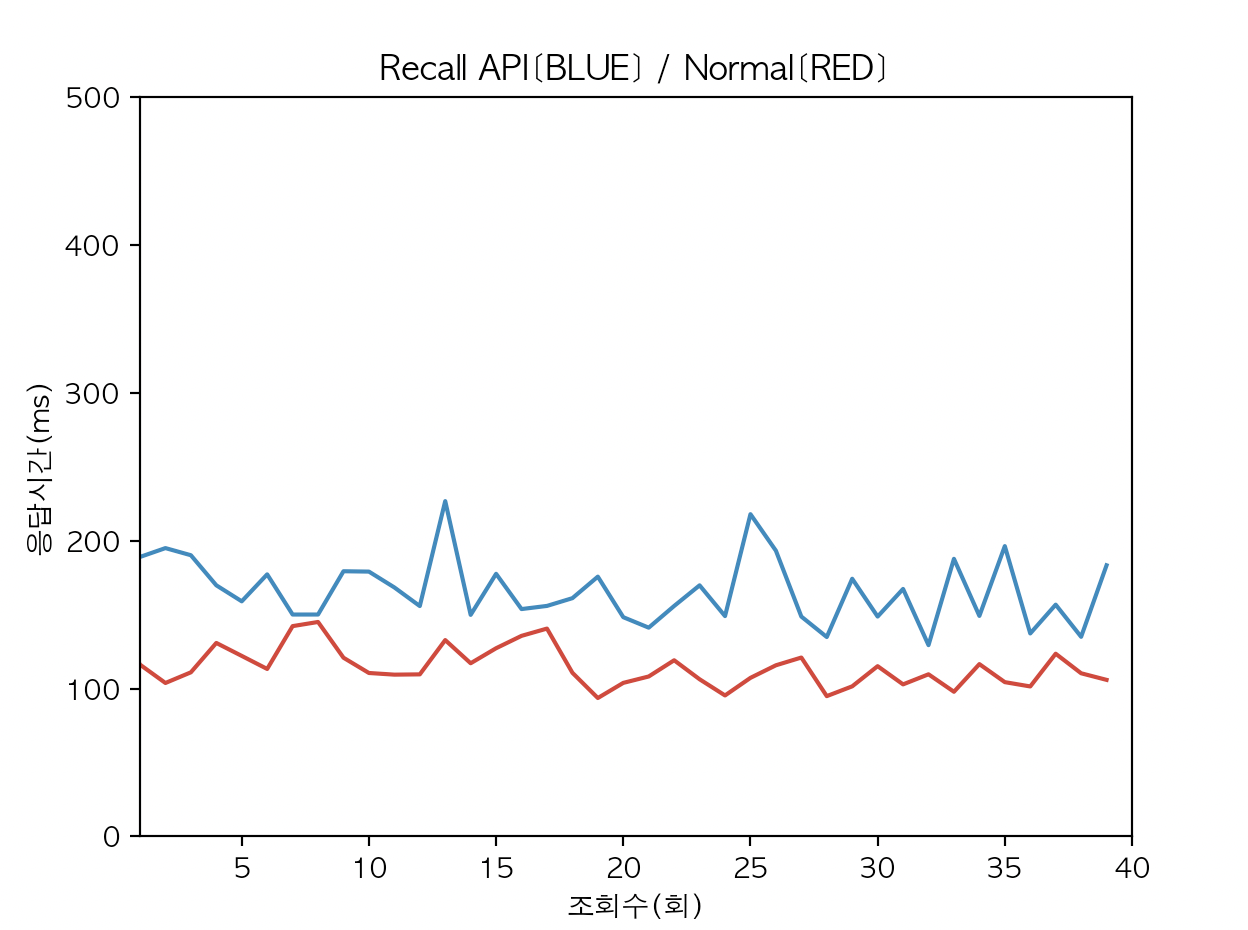
ax.plot(apix, api_data, color='tab:blue')
ax.plot(apix, jg_data, color='tab:red')
ax.set_ylabel('응답시간(ms)')
ax.set_xlabel('조회수(회)')
# create the events marking the x data points
xevents1 = EventCollection(apix, color='tab:blue', linelength=0.05)
xevents2 = EventCollection(apix, color='tab:red', linelength=0.05)
# create the events marking the y data points
yevents1 = EventCollection(api_data, color='tab:blue', linelength=0.05,
orientation='vertical')
yevents2 = EventCollection(jg_data, color='tab:red', linelength=0.05,
orientation='vertical')
# add the events to the axis
ax.add_collection(xevents1)
ax.add_collection(xevents2)
ax.add_collection(yevents1)
ax.add_collection(yevents2)
# set the limits
ax.set_xlim([1, len(apix)])
ax.set_ylim([0, 500])
ax.set_title('Recall API[BLUE] / Normal[RED]')
# display the plot
plt.show()
##### MAIN SCRIPT #####
if __name__ == '__main__':
CSV_FILE = "./data/recall_b.csv"
# CSV_FILE = "./data/recall_y.csv"
csv_data()
print("Done.")재현율 개선 쿼리와 일반쿼리 응답시간 비교
# -*- coding: utf-8 -*-
import time
import json

import requests
import ssl
import urllib3

from ssl import create_default_context
import matplotlib.pyplot as plt
from matplotlib.collections import EventCollection
import numpy as np
from time import sleep

plt.rcParams['font.family'] = 'AppleGothic'

print(ssl.OPENSSL_VERSION)
urllib3.disable_warnings(urllib3.exceptions.InsecureRequestWarning)


def csv_data():
    count = 1;
    progress = 0;

    api_data = []
    jg_data = []

    print("Start.")
    with open(CSV_FILE) as data_file:
        for line in data_file:
            line = line.strip()
            time.sleep(0.5)
            url_jg = "https://totalsearch.kr/search?sort=RANK&inputKeyword=" + line + "&searchKeyword=" + line + "&page=1&perPage=20"
            search_start = time.time()
            response_jg = requests.get(url_jg, verify=False)
            search_time = time.time() - search_start
            jg_data.append(round(search_time * 1000, 2))

            url_api = "https://totalsearch.kr/search?sort=RANK&inputKeyword=" + line + "&searchKeyword=" + line + "&page=1&perPage=20&recall=Y"
            api_start = time.time()
            response_api = requests.get(url_api, verify=False)
            api_time = time.time() - api_start
            api_data.append(round(api_time * 1000, 2))
            print(line)

    print("== Recall api 실행시간 ==")
    for atimes in api_data:
        print(str(atimes) + " ms.")

    print("== Normal api 실행시간 ==")
    for jtimes in jg_data:
        print(str(jtimes) + " ms.")

    # 평균 구하기
    average_api = np.mean(api_data)
    average_jg = np.mean(jg_data)

    # print("전체쿼리 횟수: {} 회".format(len(keywords)))
    print("Recall api 평균응답시간:  {} ms.".format(round(average_api, 2)))
    print("Normal 평균응답시간:  {} ms.".format(round(average_jg, 2)))

    apix = range(len(api_data))
    jgx = range(len(jg_data))

    # as-is, to-be 성능차이 계산
    print("응답시간 증가 : {}%.".format(round(((average_api / average_jg) - 1) * 100, 2)))

    # plot the data
    fig, ax = plt.subplots()
    ax.set_title('recall VS normal')
    line1, = ax.plot(apix, api_data, lw=2, label='recall')
    line2, = ax.plot(apix, jg_data, lw=2, label='normal')
    leg = ax.legend(fancybox=True, shadow=True)

    ax.set_ylabel('query 속도(ms)')
    ax.set_xlabel('조회수(회)')

    lines = [line1, line2]
    lined = {}  # Will map legend lines to original lines.
    for legline, origline in zip(leg.get_lines(), lines):
        legline.set_picker(True)  # Enable picking on the legend line.
        lined[legline] = origline


    def on_pick(event):
        legline = event.artist
        origline = lined[legline]
        visible = not origline.get_visible()
        origline.set_visible(visible)
        legline.set_alpha(1.0 if visible else 0.2)
        fig.canvas.draw()

    fig.canvas.mpl_connect('pick_event', on_pick)
    plt.show()


##### MAIN SCRIPT #####

if __name__ == '__main__':
    # CSV_FILE = "./data/recall_b.csv"
    CSV_FILE = "./data/recall_y.csv"
    csv_data()
    print("Done.")
반응형
'Python > matplotlib' 카테고리의 다른 글
| [matplotlib] legend picking chart sample (0) | 2022.08.19 |
|---|---|
| [matplotlib] two subplot chart sample 1 (0) | 2022.08.19 |
| [matplotlib] pie chart sample 1 (0) | 2022.08.19 |
| [matplotlib] line chart sample 2 (0) | 2022.08.19 |
| [matplotlib] line chart sample 1 (0) | 2022.08.19 |
'Python/matplotlib' Related Articles
more


Comments