
| 일 | 월 | 화 | 수 | 목 | 금 | 토 |
|---|---|---|---|---|---|---|
| 1 | 2 | 3 | 4 | 5 | ||
| 6 | 7 | 8 | 9 | 10 | 11 | 12 |
| 13 | 14 | 15 | 16 | 17 | 18 | 19 |
| 20 | 21 | 22 | 23 | 24 | 25 | 26 |
| 27 | 28 | 29 | 30 |
- analyzer test
- MySQL
- aggs
- licence delete curl
- Test
- ELASTIC
- Java
- springboot
- 차트
- aggregation
- matplotlib
- high level client
- docker
- flask
- 900gle
- plugin
- license delete
- License
- API
- Python
- token filter test
- zip 파일 암호화
- Kafka
- zip 암호화
- query
- 파이썬
- Elasticsearch
- Mac
- TensorFlow
- sort
- Today
- Total
목록분류 전체보기 (477)
개발잡부
 Error response from daemon: Container 2c8318196be216b730907022eccaffc314fdd7e5d8e0286ea3f6b1d219acd5c0 is restarting, wait until the container is running
Error response from daemon: Container 2c8318196be216b730907022eccaffc314fdd7e5d8e0286ea3f6b1d219acd5c0 is restarting, wait until the container is running docker logs kafka1 ERROR: Missing environment variable KAFKA_LISTENERS. Must be specified when using KAFKA_ADVERTISED_LISTENERS 아래 2값을 유니크 하게 만들어 준다 KAFKA_ADVERTISED_HOST_NAME: ${EXPOSED_HOSTNAME}1 KAFKA_ADVERTISED_LISTENERS: PLAINTEXT://${EXPO..
 [kafka] docker dompose multi broker kafka 3.6
이거 버려.. cd /Users/doo/docker/kafka (base) ➜ kafka docker compose -f docker-compose.yml up -d --build docker-compose exec kafka1 kafka-topics --create --topic 900gle --bootstrap-server kafka1:9092 --replication-factor 3 --partitions 2 Error response from daemon: Container 2c8318196be216b730907022eccaffc314fdd7e5d8e0286ea3f6b1d219acd5c0 is restarting, wait until the container is running version: '..
 [kafka] docker dompose multi broker kafka
kafka 실행 $ docker compose -f docker-compose.yml up -d --build 토픽생성 $ docker-compose exec kafka-1 kafka-topics --create --topic 900gle --bootstrap-server kafka-1:9092 --replication-factor 3 --partitions 2 컨슈머 생성 docker-compose exec kafka-1 bash [appuser@c6204ce58d07 ~]$ kafka-console-consumer --topic 900gle --bootstrap-server kafka-1:9092 프로듀서 생성 docker-compose exec kafka-1 bash [appuser@c6204ce5..
 [tf] 유사성 측정
import tensorflow as tf import tensorflow_text as text hypotheses = tf.ragged.constant([['captain', 'of', 'the', 'delta', 'flight'], ['the', '1990', 'transcript']]) references = tf.ragged.constant([['delta', 'air', 'lines', 'flight'], ['this', 'concludes', 'the', 'transcript']]) result = text.metrics.rouge_l(hypotheses, references) print('F-Measure: %s' % result.f_measure) print('P-Measure: %s' ..
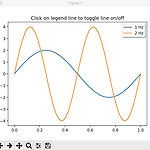 [matplotlib] legend picking chart sample
legend picking chart 혹은 TGV (Tejeb) 이라고 함 legend picking 때잽질을 하려면 보고가 생명인데, 이 때잽질이라는게 말로 나불거려서 때르잽이 되려면 1급 때잽이여야 하고 텍스트로만 보고하기에는 이해하는 놈들이 일본애니 마니아라서 이해하는데 한계가 있고, 변태스러운 2D 마니아들을 위한 맞춤 보고서를 작성해야 하는데 그때를 대비해서 쓸만한 차트를 몇개 알아놓고 신속하게 때르잽질을 한다 sample import numpy as np import matplotlib.pyplot as plt t = np.linspace(0, 1) y1 = 2 * np.sin(2*np.pi*t) y2 = 4 * np.sin(2*np.pi*2*t) fig, ax = plt.subplots() ..
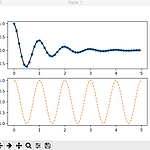 [matplotlib] two subplot chart sample 1
import numpy as np import matplotlib.pyplot as plt def f(t): return np.exp(-t) * np.cos(2*np.pi*t) t1 = np.arange(0.0, 5.0, 0.1) t2 = np.arange(0.0, 5.0, 0.02) plt.figure() plt.subplot(211) plt.plot(t1, f(t1), color='tab:blue', marker='o') plt.plot(t2, f(t2), color='black') plt.subplot(212) plt.plot(t2, np.cos(2*np.pi*t2), color='tab:orange', linestyle='--') plt.show()
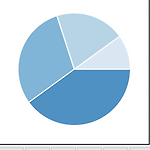 [matplotlib] pie chart sample 1
import matplotlib.pyplot as plt import numpy as np plt.style.use('_mpl-gallery-nogrid') # make data x = [1, 2, 3, 4] colors = plt.get_cmap('Blues')(np.linspace(0.2, 0.7, len(x))) # plot fig, ax = plt.subplots() ax.pie(x, colors=colors, radius=3, center=(4, 4), wedgeprops={"linewidth": 1, "edgecolor": "white"}, frame=True) ax.set(xlim=(0, 8), xticks=np.arange(1, 8), ylim=(0, 8), yticks=np.arange(..
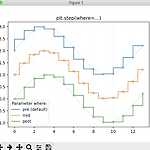 [matplotlib] line chart sample 2
import numpy as np import matplotlib.pyplot as plt x = np.arange(14) y = np.sin(x / 2) plt.step(x, y + 2, label='pre (default)') plt.plot(x, y + 2, 'o--', color='grey', alpha=0.3) plt.step(x, y + 1, where='mid', label='mid') plt.plot(x, y + 1, 'o--', color='grey', alpha=0.3) plt.step(x, y, where='post', label='post') plt.plot(x, y, 'o--', color='grey', alpha=0.3) plt.grid(axis='x', color='0.95')..
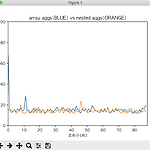 [matplotlib] line chart sample 1
import matplotlib.pyplot as plt from matplotlib.collections import EventCollection import numpy as np plt.rcParams['font.family'] = 'AppleGothic' xdata= range(0, 88) ydata1= [67.89, 15.56, 12.77, 13.39, 15.69, 13.18, 16.3, 13.92, 16.8, 14.18, 15.05, 28.49, 15.1, 14.96, 12.1, 13.23, 16.92, 13.55, 16.1, 14.2, 15.43, 12.78, 15.55, 12.78, 12.35, 15.06, 14.21, 15.68, 12.33, 14.07, 15.72, 17.83, 14.73..
 [tf] RNN을 사용한 텍스트 분류
VOCAB_SIZE = 1000 encoder = tf.keras.layers.TextVectorization( max_tokens=VOCAB_SIZE) encoder.adapt(train_dataset.map(lambda text, label: text)) import numpy as np import tensorflow_datasets as tfds import tensorflow as tf tfds.disable_progress_bar() import matplotlib.pyplot as plt def plot_graphs(history, metric): plt.plot(history.history[metric]) plt.plot(history.history['val_'+metric], '') p..